Stanford University HIV Drug Resistance Database - A curated public database designed to represent, store, and analyze the divergent forms of data underlying HIV drug resistance.

Genotype-Treatment Correlations

Queries

1. Detailed Treatment/Mutation Queries
2. Treatment Profiles
3. Mutation Profiles
4. Detailed in vitro Selection Queries
 

Data Summaries

1. Mutation Prevalence
According to Subtype and Treatment
2. Downloadable Dataset

 
Users specify treatment and mutation information. The query then returns a table of virus isolates meeting the selected criteria. The table contains links to Medline (Author-Yr column) and GenBank (Accession column). The sequences in the table can also be viewed as a sequence alignment, downloaded in fasta format, or viewed with the graphical Treatment Profile format. Users can specify the number of drugs of a particular class, specific drugs, and specific drug combinations. Users can also specify the manner win which the mutation data and treatment data are displayed in the table. Users can also filter their results according to a variety of criteria.
 
Mutation frequencies at each position of protease or RT according to subtype and treatment. Users can also select a reference profile (usually viruses from untreated person) for comparison. The results are graphical.
 
Users specify a particular position. The program then returns a separate table for each observed mutation at that position. The table entries show the prevalence of the mutation in untreated persons, in persons receiving the relevant drug class (PIs for protease; NRTIs and NNRTIs for RT), and in persons receiving each of the drugs of the relevant drug class. Significant differences between the prevalence of a mutation in treated and untreated persons is calculated using a chi-square test and shown in each row of each table.
 
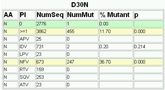
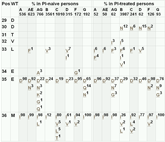
Summary tables listing the prevalence of each mutation according to subtype and drug-class experience. Users can adjust the threshold for the minimum prevalence of a mutation required for it to appear in the summary tables. Users can also choose whether or not mutations present as part of electrophoretic mixtures should be counted as a mutation or ignored.

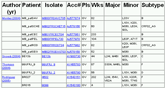
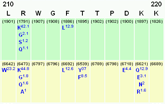
Mutation prevalence is indicated by the superscripted number following each mutation. Each mutation is also a hyperlink to a separate web page with detailed information on each isolate containing the mutation and meeting the appropriate subtype and treatment criteria.